I recently relaunched tablecloth.time with version 1.00-alpha-6. The goal of this project, which remains experimental, is to build a composable extension for temporal analysis on top of tablecloth, the primary dataframe library in the Clojure data science ecosystem. Tablecloth was created by @generateme within the SciCloj community and is built on tech.ml.dataset, a high-performance columnar data library.
tablecloth.time originally began several years ago with an index-based design inspired by Pandas. But when tech.ml.dataset removed its indexing mechanism in v7, it prompted a rethink. The new direction aligns with how tablecloth already works — explicit column arguments, composable operations, no metadata magic.
Indexing and Optimization
The original design mimicked Python Pandas, where you set a time column as your DataFrame’s index:
df = df.set_index('Time')Once set, operations like slicing and resampling work implicitly on that index:
df['2024-01']              # all rows from January 2024
df.resample('D').mean()    # daily averages
The index is invisible but ever-present — you don’t pass the time column to these functions; they just know.
Rethinking the Need for an Index
At the time the project began, the index seemed necessary both because it was a familiar and convenient tool, and it offered what seemed like necessary optimizations when doing operations that involved subsetting the dataset where using a tree structure offered O(log(n)) optimization.
However, ultimately, neither turned out to be good rationales for an index. Unlike in Python, Clojure’s datasets are immutable. They’re recreated wholesale each time you transform them. Under these circumstances, the optimization offered by a tree-based index is moot: the constant overhead of needing to build and sometimes rebuild the tree negates the benefit, and a simple binary search on sorted data performs equally well or better.
This insight emerged from a discussion on the Clojurians Zulip in late 2024, after tech.ml.dataset removed its indexing mechanism. Chris Nuernberger, the author of dtype-next and tech.ml.dataset, put it plainly: “You only need tree structures if you are adding values ad-hoc or removing them — usually with datasets we aren’t adding/removing rows but rebuilding the index all at once. Just sorting the dataset and using binary search will outperform most/all tree structures in this scenario.” The simplicity of not needing an index is not a compromise.
There was still, however, the question of whether the index was a
useful abstraction for the user. An index allows the user to mark off
certain data as the key pivot for analysis, while index-aware functions
offer a degree of “magic” allowing the user to simply call a function
like slice without needing to say what they intend to
slice. In R’s tsibble package, for example:
vic_elec <- as_tsibble(data, index = Time)
vic_elec |> index_by(Date = as_date(Time)) |> summarise(Demand = mean(Demand))
The index = Time declaration ripples through everything
— index_by knows what to group on, plotting functions know
the x-axis, and interval detection happens automatically. It’s elegant,
which makes this approach desirable, but it’s also implicit state
threaded through your data. So while the question of optimization could
be answered more definitively, the UX issues involved real choices.
Favoring Clarity and Composability
That said, within the Clojure data community there was a detectable preference for an approach that offered less magic and greater transparency — clearly represented in @generateme’s design of tablecloth’s API. In tablecloth, you always say what you mean:
(-> ds
    (tc/select-columns [:Time :Demand :Temperature])
    (tc/order-by [:Time])
    (tc/group-by [:Date]))
No hidden state, no implicit pivots. Each function takes the data and the columns it operates on. The pipeline reads like what it does. This, of course, is a hallmark of Clojure itself where we prefer to solve complex problems by starting with small pure functions that simply modify immutable data. The beauty of the tech.ml.dataset’s objects is that they can be treated the same way.
The software engineer Dan Palmer recently termed this approach “flattened simplicity.” For Palmer, keeping things simple by not hiding details is one pole on a spectrum — at the other end sits “abstracted simplicity,” where details are hidden in favor of high-level concepts. Neither approach is inherently right; in practice we seek to balance the tension between them.
In reviving tablecloth.time, I have been following the flattened pattern. While it might at some point be useful to mark a column as “the time index” and build functions that use that information, for the moment tablecloth.time provides explicit primitives that compose with standard tablecloth operations. You simply say which column you’re working with. You see exactly what’s being computed.
Working through a Use Case
We can see this trade-off by working through a concrete case: resampling — aggregating time series data to a coarser resolution.
In Pandas, we see a classic example of abstracted simplicity:
df.resample('D').mean()This is one opaque line. ‘D’ is a frequency string meaning “daily” — one of dozens of such codes (‘W’ for weekly, ‘M’ for monthly, ‘H’ for hourly, and so on). The operation uses the implicit DateTimeIndex and automatically aggregates every numeric column. Convenient, but what exactly is happening?
Right now tablecloth.time doesn’t have a resample function. Instead, resampling is just a pattern — composable primitives that work with standard tablecloth:
(-> ds
    (tct/add-time-columns :Time [:day])
    (tc/group-by [:day])
    (tc/aggregate {:Demand #(dfn/mean (% :Demand))}))
You choose what temporal component to extract. You specify the time
index (:Time). You choose what to group by. You choose what
to aggregate. Each step is visible, each step composes with the rest of
your pipeline. The code reads like what it does — a property Clojure
programmers tend to value.
Polars, the Rust-based DataFrame library that’s become the fastest-growing Pandas alternative, has reached the same conclusion — no index by design. The resampling pattern looks strikingly similar:
(df
 .with_columns(pl.col('Time').dt.date().alias('day'))
 .group_by('day')
 .agg(pl.col('Demand').mean()))
Layering Convenience Later
Explicit primitives don’t preclude convenience. At some point, this
resampling pattern could be packaged into a resample
function. That would be magic to some degree, but this function would
also just name the index:
(-> ds
    (tct/resample :Time :day) ;; returns group-ds
    (tct/aggregate {:Demand #(dfn/mean (% :Demand))}))
Indeed, we could even in this development return to the question of
whether it makes sense to mark an index within an expression — perhaps
something like (tct/with-time-index :Time) that sets
metadata for subsequent operations to read. That would be
implicit state, but set visibly, in the expression that uses it.
The key distinction from Pandas: in tablecloth.time, the index would
be pure convenience. The primitives always take explicit column
arguments. You could use with-time-index if you want, but
you could always drop down to:
(tct/resample ds :Time :day)The index would be optional sugar, not architecture. That’s the difference. Right now, though, I am holding off on building such abstractions. Sticking to the flattened, declarative transformations helps reveal the shape of the patterns that could eventually be wrapped as conveniences.
What’s Available Now
The current release provides a small set of focused primitives. Here’s what they look like in action.
Extracting temporal components
add-time-columns extracts fields from a datetime column
— day-of-week, month, hour, etc. — as new columns you can group or
filter on:
(-> vic-elec
    (tct/add-time-columns :Time [:day-of-week])
    (tc/group-by [:day-of-week])
    (tc/aggregate {:Demand #(dfn/mean (:Demand %))}))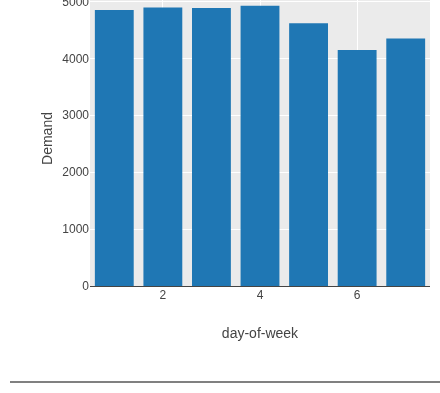
Weekends clearly have lower demand. The :day-of-week
field came from add-time-columns; the rest is standard
tablecloth.
Slicing time ranges
slice selects rows within a time range using binary
search on sorted data:
(-> vic-elec
    (tct/slice :Time "2012-01-09" "2012-01-15"))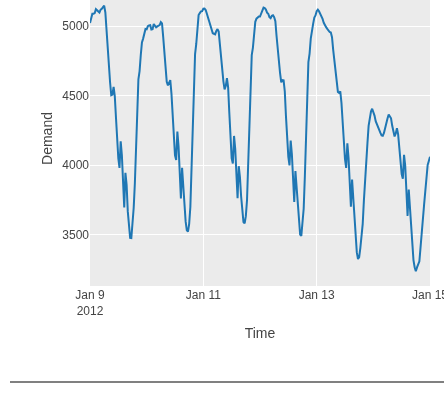
Fast even on large datasets. Accepts date strings, datetime literals, or epoch milliseconds.
Lag and lead columns
add-lag shifts column values by a fixed number of rows —
useful for autocorrelation analysis. Note this is row-based, not
time-aware: you need to know your data’s frequency and calculate the
offset. Since this dataset has half-hourly readings, a lag of 48 rows
equals 24 hours:
(-> vic-elec
    (tct/add-lag :Demand 48 :Demand_lag48)
    (plotly/layer-point {:=x :Demand_lag48 :=y :Demand}))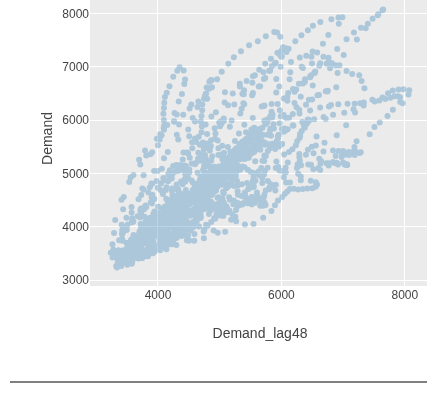
The tight diagonal shows demand is highly correlated with the same time the previous day — a pattern you’d expect for electricity usage.
These primitives compose with standard tablecloth operations —
group-by, aggregate, order-by —
to build analysis pipelines. For more worked examples, see the fpp3
Chapter 2 notebook.
What’s Next
tablecloth.time is experimental. The API will evolve as patterns emerge from real use. Planned areas include:
- Rolling windows — moving averages, rolling statistics
- Differencing — for stationarity
transformations
- Higher-level patterns —
resample,seasonal-decomposebuilt on the primitives - Better integration with tableplot — time-aware plotting defaults
If you’re working with time series in Clojure and want to try it out, feedback is welcome. The repository is on GitHub.
I welcome feedback, so please write to me via email.